
Creating a data platform in a dynamic market

Case Study
PANGAIA experienced rapid growth during the pandemic and needed to gain a deeper understanding of performance, with this in mind PANGAIA set its sights on becoming a data driven company that understands and focused on its customers and creates a data platform that enable efficiencies that results in tangible benefits to its staff and clients.
The analytics department set out a clear strategy and recognised that in order to achieve their ambition they had to look to establishing a long-term partnership with a reliable data partner and technology provider that has both retail and ecommerce expertise and the technology depth to support its journey

Key objective
As a thriving eCommerce entity on an accelerated growth trajectory, PANGAIA Overarching Objective in analytics was to be a truly data driven company. To achieve this, they needed to create an asset out of the data and to strategically elevating the centrality of data within its operational framework. Recognizing the pivotal role that data plays in shaping successful strategies and operations their objectives were to:
Reduce manual manipulation of data which is error prone and consumes time in mundane repetitive tasks
Understand digital spend and attribution of sales
Analyse waste and returns
Seamlessly integrate and leverage data to drive informed decision-making, enhance customer experiences, and propel PANGAIA to new heights in the competitive eCommerce landscape
Model success and understand what works and what doesn’t across e-com, marketing and patterns using the data
Key challenges
100+ disconnected apps generating siloes of data.
Being a company that grew during the pandemic drove a greater degree of silo’d approach with most business functions utilising multiple solutions to help them better understand their business functions, with data from Google Analytics, Social Media, Sales, Market Research, returns and more
Lack of trust in key metrics
Mismatched spreadsheets and shared data lead to distrust in what was being reported, multiple business functions coming to meetings with their number.
Vanity Metics / KPI reporting but no understanding of the drivers.
Due to data coming from disparate sources key meetings consisted of reporting on topline metrics.
These resulted in limited Insights and no real understanding of performance.
Slow manual reporting and analysis.
Most reporting was conducted in app (i.e. reporting in Shopify) any manipulation and presentation of data was conducted in Excel and Powerpoint
Current reporting methods left no time to build any changes into the system
The Journey
The PANGAIA analytics team conducted a review of existing systems, the company strategy and the direction needed to take the company to the next level. Following sign off from the executive of the business case, PANGAIA conducted a RFP approach with a number of leading data partners. On completion of the process Camden AI were selected as the SI partner for data and analytics.
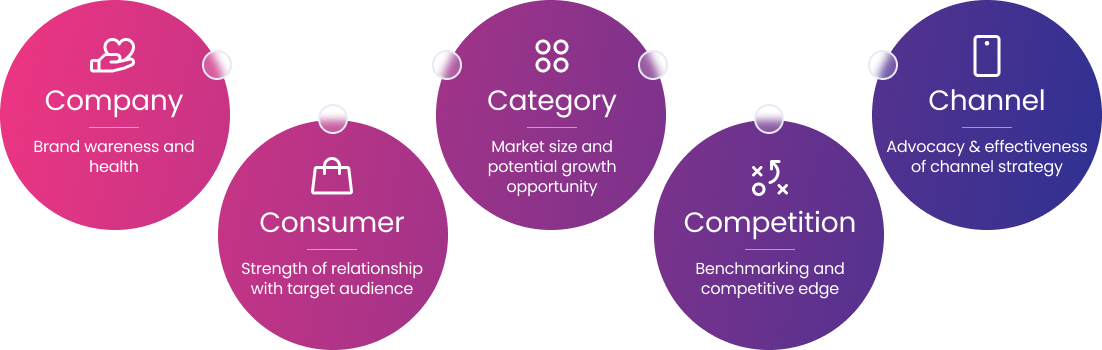
The relationship between PANGAIA and Camden AI was a true partnership and collaboratively set a 3 year strategy with a clear vision to unlock the power of data for 5 key areas.
What was delivered
Developed a data warehouse, integrating several key data sources – including e-commerce platforms, web analytics and reporting platforms, social media platform, customer engagement and post-purchase experience platform, customer service and support platform and influencer marketing platform.
Full data dictionary to ensure consistency of key data definitions across the business.
MVP marketing analytics dashboards delivered in weeks.
Deep strategic analytics unlocked by the power of the data platform.
Ongoing dashboard development that enables the exposure of key business KPI + over 40 dashboards developed to date supporting and enabling 7 key business functions
Tangible Results
Implemented a robust scalable Data Warehouse.
Achieved rapid reporting, reducing turnaround time from days to minutes.
Replaced vanity metrics with a robust set KPIs underpinned with functional PI’s enabling the implementation of a measurement framework.
Established a “single version of truth” for data, trusted by the whole organisation and used to run key business meetings.
Empowered employees to run their own business function and independently discover data insights.
Discovered and addressed over $½ million in returns fraud.
Demonstrated the capacity to efficiently implement changes to existing systems.

Want to see the same success for your buisness?

Technology Platforms.


